Talking Points:
- As looked at earlier in this module, Fibonacci retracements can help traders to identify possible support/resistance.
- We’ve previously discussed how a trader can use Fibonacci retracements on long-term-charts, and by focusing on multiple major moves traders may be able to glean confluent areas of support/resistance. This can provide multiple reasons for buyers or sellers to defend these key spots on the chart, keeping the door open for reversals or retracements.
Fibonacci is wrapped in mystique, and this makes the story around it that much more interesting. But for applicability in markets, the simple version is that Fibonacci retracement levels offer potential areas for support and/or resistance to develop; and because market participants may use these levels in their analysis and, in turn, because these prices have potential impact for price behavior, this can be an excellent addition to the FX traders repertoire of support and resistance analysis.
Origins
Italian mathematician Leonardo Fibonacci is credited with finding the Fibonacci sequence in the 13th century, hence the name ‘Fibonacci’. And while his book Liber Abaci introduced the Fibonacci sequence to the western world, traces can actually be found going back as far as 200 BC in Indian mathematics. The sequence is fairly simple: Two numbers added together produce the next value. So 1+1 = 2, and then 1+2 = 3, and then 2+3 = 5, 5+3 = 8, and so on. The first 22 values of the Fibonacci sequence are printed below:
1, 1, 2, 3, 5, 8, 13, 21, 34, 55, 89, 144, 233, 377, 610, 987, 1597, 2584, 4181, 6765, 10946, 17711
This starts to get interesting once we look at the numbers relationship within the sequence to each other. If we take a value and divide by the preceding value, we will get a number approximately close to 161.8%. So, each number in the sequence is 161.8% greater than the prior value after we get out of the initial portion of the sequence (after the value of 89). This is the Golden Ratio of 161.8%.
17711/10946 = 1.61803
10946/6765 = 1.61803
6765/4181 = 1.61803
What struck Fibonacci almost a thousand years ago and the same thing that amazed a thousand years before that is how widely this ratio, and this sequence can be found in the world around us. In Liber Abaci, Fibonacci used the mating cycle of rabbits as an example, showing how rabbit populations in isolation would grow according to the numerical sequence of 1, 1, 2, 3, 5, 8, 13, etc. But this is just the tip of the iceberg, the number of flower petals will often follow the sequence: Lilies have three petals while buttercups have five, chicory’s have 21 and daisies have 34. Each petal is placed at .618 per turn in order to allow for maximum sunlight. Tree branches, in the way that trunks split and in the way that branches will grow, display the Fibonacci sequence. Shells, hurricanes – even human faces adhere to the Golden ratio in a geometric spiral pattern.
Right now, you can look down at your right arm to notice that you probably have eight fingers, five on each hand, three bones in each finger,two bones in each one thumb and one thumb on each hand. Oh – and the ratio between your forearm and hand – that probably applies by the Golden ratio, as well.
Applicability to Markets
While the application of Fibonacci in nature keeps many graduate level mathematics students busy, traders have more pressing concerns: Applying the study to financial markets. In its most common form, Fibonacci is the use of the golden ratio in support and resistance analysis. So, plot a significant move, draw a line at 61.8% of that move, and we have an area to watch for a possible retracement to find support. The reciprocal of .618 is .382, so this gives us another value to work with at the 38.2% level.
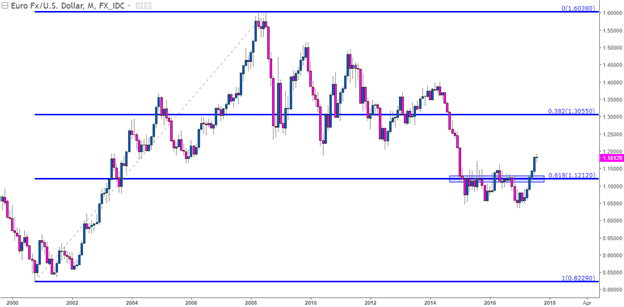
On the chart below, we’re looking at the lifetime move in EUR/USD, taking the low in the year 2000 up to the high in 2009. We start at the beginning of the move and draw the retracement to the top, and 38.2% of the way-down we can see the retracement at 1.3056. We can also see the 61.8% retracement of this move at 1.1212. Notice how this level helped to set resistance in the pair for 15 out of 30 months after the level came into play in January of 2015. As EUR/USD was dropping like a rock in anticipation of ECB QE coming online in a few short months, we caught support at this level on the way down in January of 2015; but after that we had eight consecutive months of resistance showing at or around this key 61.8% retracement level.
EUR/USD Monthly: 15 of 30 Months with Resistance at 61.8% Retracement, 3 Months of Support

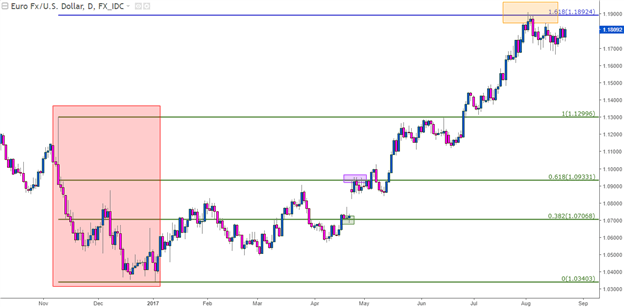
The past few months have been quite the wild ride for EUR/USD. After a rather threatening drop around the U.S. Presidential Election leading into the start of 2017 (shown in red below), the pair put in an aggressive reversal as bulls have run amok. But – when prices were in the process reversing from the prior bearish mode into a more bullish state, the 38.2% retracement of the post-Election move showed up as a bit of support (shown in green) before the 61.8% retracement provided a bit of resistance (indicated with purple). After prices broke above those highs and ran with reckless abandon, resistance has begun to show at the 161.8% extension of that move (orange box)
EUR/USD Daily: Fib Applied to recent move in EUR/USD, 161.8 Extension Providing Resistance

Taking it a Step Further
Levels found at 61.8 and 38.2% retracements can be valuable for traders, and this can be seen on major moves of all stripes and flavors. This can be applied on short-term charts just like long-term charts, but as is usually the case in technical analysis, longer-term studies will have a tendency to be a bit more consistent given the larger number of opinions over the greater evaluation period.
But we can go a step further with Fibonacci analysis. Earlier, we shared that .382 is the reciprocal of .618, and this is true – but this isn’t the only relevance behind .382. If we take any number in the sequence after the initial set of values, and divide it by the value two places further in the sequence – we will have .382 or 38.2%.
13/34 = .382
21/55 = .3818 – rounded up to .382
34/89 = .382
55/144 = .3819
But we can go even a step further by dividing a value in the sequence by the value three places later to consistently arrive at a value of 23.6.
13/55 = .2363
21/89 = .2359
34/144 = .2361
55/233 = .2361
This gives us another retracement value to work with of 23.6%. So, now we have the 23.6, 38.2 and 61.8% retracement levels to apply in the effort of finding support and/or resistance.
We’re not done yet: We can still take this a step further. With 23.6, 38.2 and 61.8% retracement levels, the study will be rather uneven with two values in one half of the retracement and only one in the latter half. This has elicited creativity across market participants, as many will simply take the reciprocal of 23.6 and apply that as a level, as well. This would be the 76.4% retracement, which doesn’t have any actual Fibonacci relevance behind it. But – at .786 we have an interesting number to work with, as this is the square root of .618, and can be a potentially more attractive stand-in to .764.
This now gives us four values across the chart, and out of practice, many traders will apply a mid-line at 50% which, again, has no actual Fibonacci value; but that observation is far less important to traders than the fact that other traders and analysts have it on their chart and, hence, may respond to it.
This now gives us five values to work with when applying Fibonacci retracements to trading analysis: 23.6, 38.2, 50, 61.8 and 78.6 (or 76.4).
Putting it All Together
As previously noted, the purpose of this analysis is not to show us what will definitely happen in the future. No form of analysis can bring that, whether it’s based on Fibonacci, Astrology or Psychological levels. The value in support and resistance identification is in the ability to manage risks with trading setups. If prices are trending higher, fantastic, then look to buy support so that if the up-trend does break-down, you can get out at a minimum of a loss, all in the effort of mitigating the damage when markets inevitably turn-around. But if that up-trend does continue, bingo, you’re in a great spot to manage a winning position.
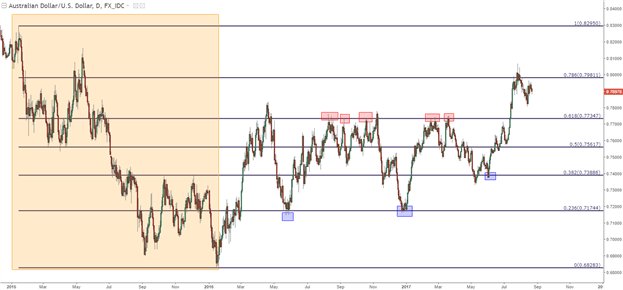
The key to applying Fibonacci retracements is to find a workable major move, and then to allow price action to be the guide in how each level should be approached. On the daily chart of AUD/USD below, we’re looking at a Fibonacci retracement applied to a previous bearish move. The 2015 high drawn down to the 2016 low is shown in orange below, and we’ve used red and blue boxes to highlight a few of the more prominent instances of resistance or support to have developed off of these intervals.

Notice that while the above chart is far from perfect in the fact that it did not catch every point of support or resistance, it did show quite a few. As we discussed in our last article, the prospect of confluence can incorporate levels from different styles of analysis, such as psychological whole numbers.
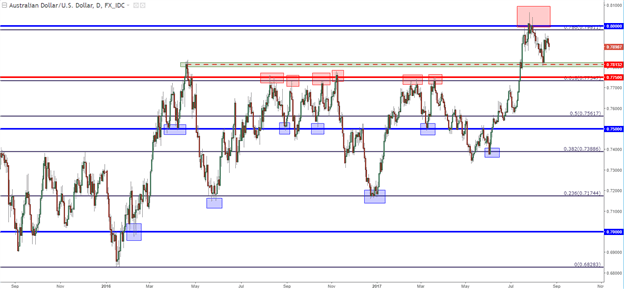
On the below chart of AUD/USD, we took the same Fibonacci retracement above and added in levels for the psychological levels at .7000, .7500 and .8000, along with a price action swing indicated with a green box. Notice, that while we don’t catch every top or bottom, we catch quite a few of them with these very simple forms of analysis. And that resistance that held in the pair around the 61.8% retracement, that level is confluent with the .7750 psychological level, and this is likely why that level was so difficult for bulls to break through.
AUD/USD Daily: Confluence of Support and Resistance

With this system of support and resistance in the analytical quiver of traders, price action can be utilized to figure out how to trade with each of these potential support or resistance inflections based on the context of that market’s condition at a specific point in time.