WHAT IS PRICE ACTION?
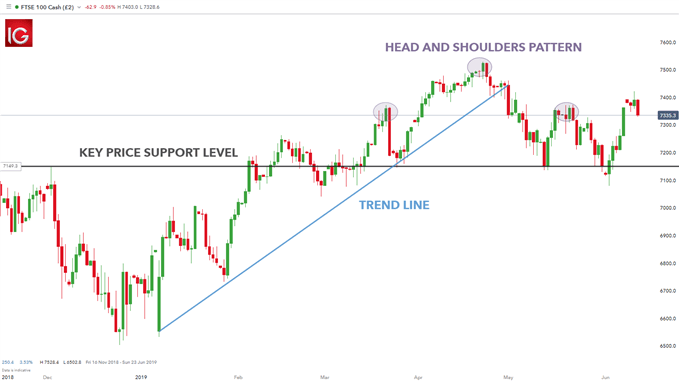
Price action is the study or analysis of price movement in the market. Traders use price action to form opinions and base decisions on trends, key price levels and suitable risk management. Trend identification is frequently utilized as the initial step in price action trading. All other facets to price action indicators require a trend basis to begin price action analysis.
Characteristic price action chart:

PRICE ACTION AS YOUR FIRST INDICATOR
Technical analysis setups generally begin with price action as the initial form of evaluation. The first thing to remember when using an indicator is that it is a function of price action. The indicator itself is not the ultimate tool when it comes to trading, but rather comes in behind price action. Price action governs the information that the indicator will ultimately provide on the chart. As such, a trader must determine what price action is doing (i.e. the trend) before consulting the indicator for an entry signal. Once the trend is determined, the trader can then consult the indicator for an entry signal in the direction of the trend.Traders trade on the price movement of an instrument therefore, the focus is on the change in price as opposed to the change in indicator value. Some traders base trading decisions and analysis purely on price action whilst other prefer a combination of price action and technical indicators which serve as a support system.
Technical indicators are derivatives of price action - price action governs the information that indicators provide on the chart. These indicators are calculated using varying periodic price data which provide substantiation for entry, exit, and stop distance criteria. Trend identification is also important in market analysis to ascertain how the market is functioning on a holistic scale (time frame dependent).
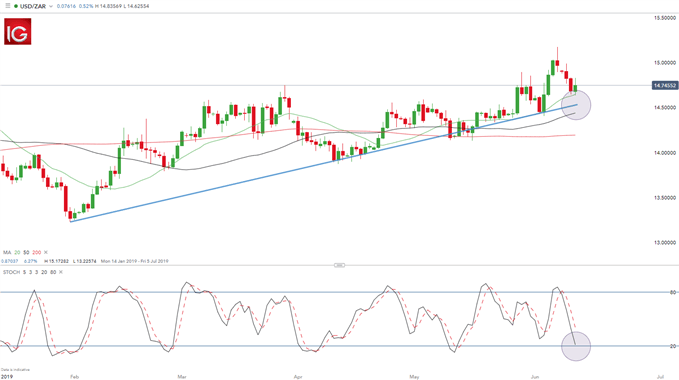
USD/ZAR price action example:

The USD/ZAR chart above exhibits the symbiotic relationship between price action and technical indicators in an archetypal trade setup. The chart arrangement begins with price action by identifying the upward trend (blue line) which also serves as a support level in this instance. The addition of the moving average (MA) further confirms the short-term trend direction with the forex price being above the 20, 50 and 200 moving average lines.
Using the stochastic oscillator suggests the market is nearly in oversold territory which points towards further bullish/upward movement. Timing the entry would require keeping an eye on the stochastic as well as the price movement as it approaches the support (blue line). Once price reaches this level, traders would look to enter into a long position with appropriate risk management.
PRICE ACTION AND TECHNICAL INDICATORS: A SUMMARY
Price action is a broad technical analysis technique that incorporates various trading strategies which traders apply to analyze the markets. Technical indicators work well in conjunction with price action to allow traders to formulate more accurate trade decisions.