In the United States and around the world, industrial stocks are one of the most long-lived industries. The economy's backbone is the industrial sector. For ages, this industry has been developing and increasing. There is still room for development and expansion. Websites that provide stock trading advice assist investors in making sound financial choices.
Investing in Industrial stocks has its own set of advantages:
- The growth of industrial stocks is linked to economic growth and is highly cyclical. Therefore, when the economy is booming, industrial stocks prove to be the best investment. But economic growth slows or the economy goes downs, its time to put a stop to your investment in the industrial stock
- Most industrial stocks have decades of history in the business; some are even centuries old. Hence investing in these industrial stocks gives investors ample data to analyze the stocks for investment worthiness
- The majority of the industrial stocks are dividend-paying companies. Hence an excellent investment source for investors seeking a regular stream of income.
On the contrary, no sector is far from its set of shortcomings. Therefore, investing in industrial stocks comes along with its own set of disadvantages:
- Even though the majority of the industrial stocks are dividend-paying companies, their dividend yield is very low. Therefore, investors seeking a good return in terms of dividends have to seek other investments
- Since industrial stocks are highly correlated with the economy, the political situation also greatly affects the industrial sector. In case of political unrest, the industrial sector goes down side by side.
List of Top 10 Industrial Stocks to Invest in 2022
Investing in any stock needs good research and should be according to the risk an investor is willing to take. Keeping in mind the investor preference, we have selected the Top 10 industrial stocks to invest in 2022:
| Sr. | Company Name | Symbol | Market Cap | Share Price (As of 10 May 2022) |
| 1 | Caterpillar | CAT | $ 108.3 billion | $ 202.99 |
| 2 | 3M | MMM | $ 84.9 billion | $ 149.12 |
| 3 | General Electric | GE | $ 80.7 billion | $ 73.31 |
| 4 | Waste Management | WM | $ 65.2 Billion | $ 163.95 |
| 5 | FedEx | FDX | $ 53.9 billion | $ 208.06 |
| 6 | United Rentals Inc. | URI | $ 21 billion | $ 293.69 |
| 7 | Howmet Aerospace | HWM | $ 14.2 billion | $ 33.98 |
| 8 | Textron | TXT | $ 13.9 billion | $ 64.23 |
| 9 | Generac Holdings | GNRC | $ 13.65 billion | $ 223.33 |
| 10 | Builders First Source | BLDR | $ 11.62 billion | $ 65.13 |
Caterpillar
Caterpillar Inc. is the world’s leading manufacturer of construction and mining equipment, off-highway diesel and natural gas engines, industrial gas turbines, and diesel-electric locomotives. Caterpillar has a presence all over the world, on every continent. The company operates through three primary segments:
- Construction Industries
- Resource Industries
- Energy & Transportation
The company also provides financing and related services through its Financial Products segment.
The company has recently published its first-quarter report for the year 2022:
- Revenue of $ 13.6 billion, an increase of 14 % from the same period last year
- Operating Profit of $ 1.9 billion, an increase of 5.6 % from the same period last year
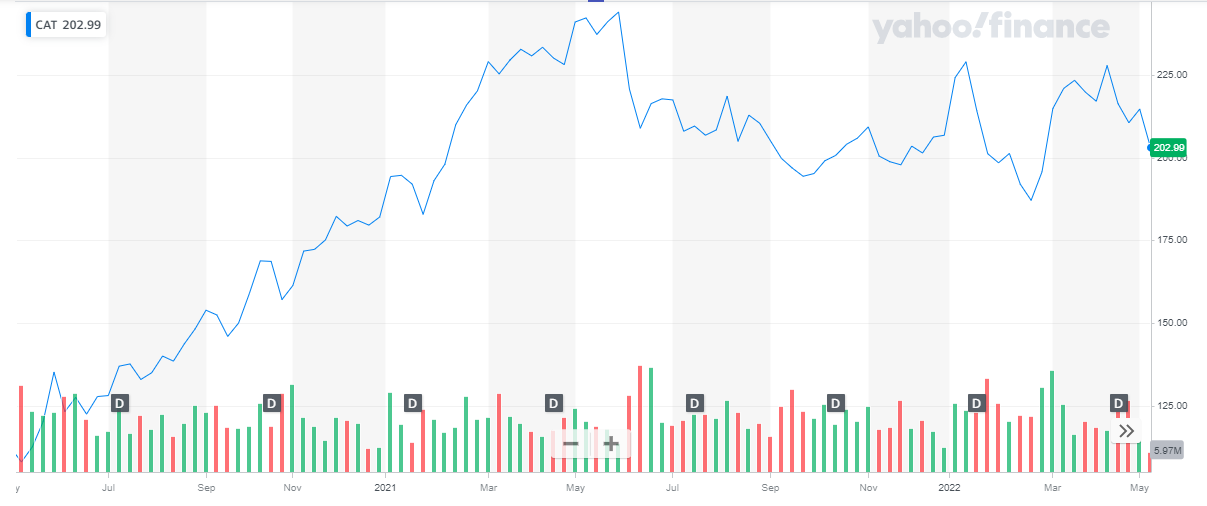
The company’s share is currently trading at a price of $ 202.99. The share peaked at $ 244 in May 2021. During the year 2021, the share appreciated by approx. 2%. In the current year, the stock of Caterpillar has been volatile. After hitting $228, the company’s stock declines. During the current year, the stock has declined by approx. 2% to date.
 Semi conductor stocks are one of the best investment opportunities.
3M
3M Company operates as a diversified technology company worldwide. It operates through four segments:
- Safety and Industrial
- Transportation and Electronics
- Health Care
- Consumer
In the recent quarterly earnings report, the company reported:
- Revenue of $ 8.8 billion, a decrease of 0.3% year-on-year
- Earnings per share were $ 2.26, an 18% decline year-on-year
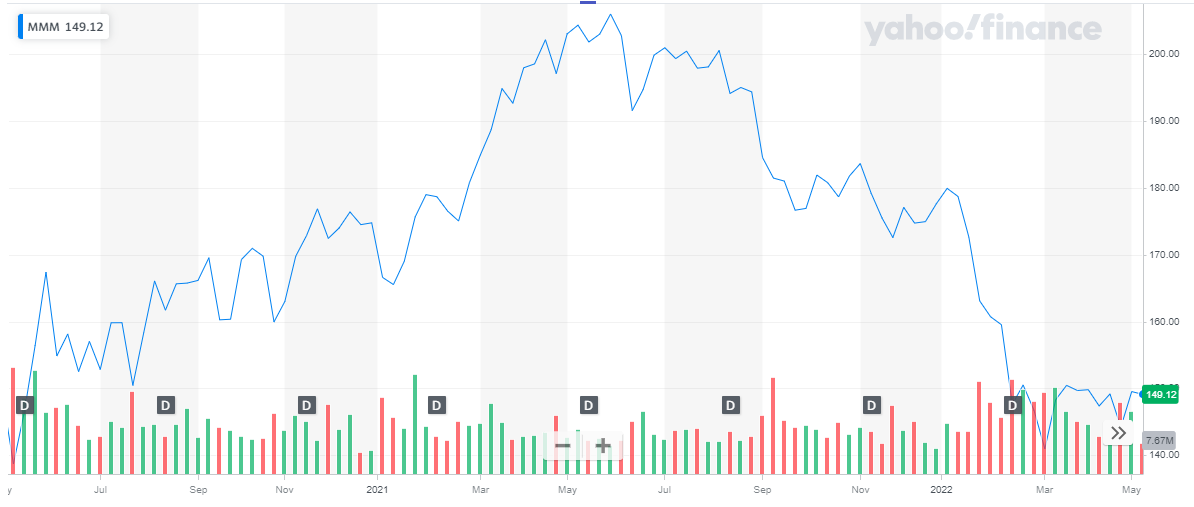
The stock of 3M is currently trading at $ 149.12. The stock peaked at $ 206 in May 2021. The year 2020 is marked by a bullish run. This bullish streak lasted till May 2021 when the stock hit its peak price. After that, the stock of 3M has been steadily declining.
During the current year, the stock has experienced a huge drop in price. Starting off at a price of $ 179.95, the stock closed off at $ 149.12 on the last trading day. This represents a decline of 17 % to date.
 Oil stocks is one of the riskier yet most profit-generating sectors.
General Electric
General Electric Company is a high-tech industrial. It operates through four segments:
- Power
- Renewable Energy
- Aviation
- Healthcare segments
General Electric Company is popular for its LEAP aircraft engines, Heavy-Duty gas turbines, Haliade-X and Cypress wind turbines, and healthcare solutions. The company’s continuous effort and investment towards the upgradation and innovation of products paves way for growth. Moreover, the company offers great technological expertise in the field of business which adds to growth. Going forward, GE plans to focus on Power, Aviation, and Renewable Energy and strengthen its industrial business. This is expected to improve the balance sheet and increase shareholders’ value. Oil and gas ETFs are a great addition to the investment portfolio. We also have covered best ETFs to buy in all categories.
In the first-quarter earnings report for the year 2022, the company reported:
- Revenues of $ 16.3 billion
- Net Profit of $ 0.9 billion, a 19% increase year-on-year
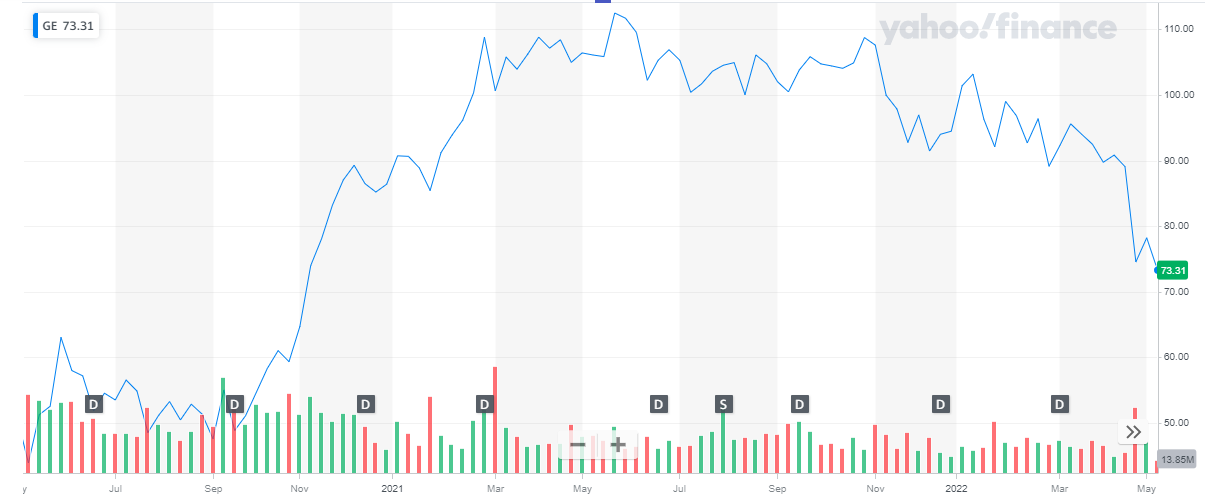
The share of General Electric is currently trading at $ 73.31. The share peaked at $ 112.48 in May 2021. Amazingly, the stock of GE maintained its price level for the next few months before dropping slightly by the end of the year 2021. The share closed off in the year 2021, at a price of $ 94.47. in the current year, the stock of GE is on a downward path and has declined by 27% to date.
 If you are seeking a steady stream of income, you should invest in REIT stocks.
Waste Management
Waste Management is the leading provider of comprehensive environmental services in North America. Through its subsidiaries, WM provides collection, transfer, disposal services, recycling, and resource recovery. It is also a leading developer, operator, and owner of landfill gas-to-energy facilities in the United States. Thinking to invest in bonds? Get to know whether its a good decision to invest in bonds or stocks.
The company recently announced that it expects to invest $ 200 million in recycling infrastructure in 2022. This new investment will take the company’s investment in new and upgraded recycling facilities to over $700 million, in 2018. The continuous investment in recycling will enable WM to capture more recycled materials and increase access to recycling for its customers.
In the first quarter report for the year 2022 the company reported:
- Revenues of $4.7 billion, an increase of 13 % from the same period last year.
- Net income of $ 513 million, an increase of 22 % from the same period last year.
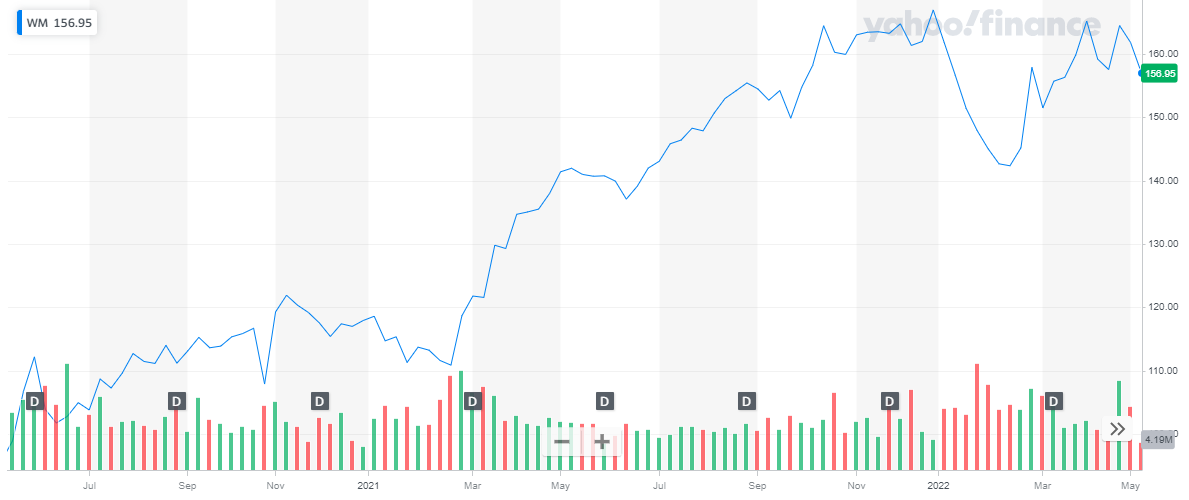
The stocks of WM are currently trading at a price of $ 156.95. The company’s share has been on a bullish streak since 2021. In the year 2021, the share appreciated by 40%. In the current year, the stock has maintained its price level, year-to-date.
 Get to know best vaccine stocks to invest in now.
FedEx
FedEx Corporation provides transportation, e-commerce, and business services in the United States and internationally. The companies’ operations have been divided into multiple segments; each segment has its individual role:
- The FedEx Express segment offers express transportation, small-package ground delivery, and freight transportation services; time-critical transportation services; and cross-border e-commerce technology and e-commerce transportation solutions.
- The FedEx Ground segment provides day-certain delivery services to businesses and residences.
- The FedEx Freight segment offers less-than-truckload freight transportation services.
The year 2020 changed the fate of FedEx. It was one of the few industrial stocks that thrived during this time. The company has benefitted hugely from economic growth and a prolonged surge in e-commerce.
In the recent quarterly earnings report, FedEx reported:
- Total revenue of $ 23.6 billion, an increase of 10 % year-on-year
- 1operatingincome was reported to be $ 1.33 billion, an increase of 32 % year-on-year
- Net Income was reported at $ 1.2 billion, an increase of 30 % year-on-year
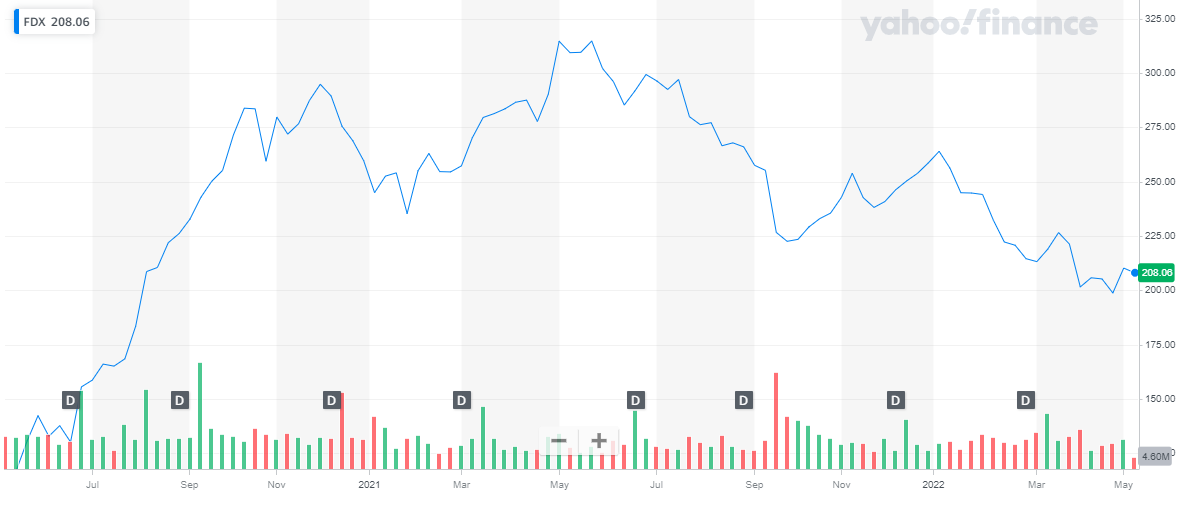
The company’s stock is currently trading at a price of $ 208.06. The stock peaked at $ 314.69 in May 2021. The pandemic gave a huge boost to the share price. After hitting the peak price, the stock has declined.
 Get to know the list of crypto mining companies that are leading the industry.
United Rentals
United Rentals is the largest equipment rental company in the world. It has a very vast store network and has a presence in 49 states and ten Canadian provinces. Also learn about Best Day Trading Stocks
No doubt the company has been grappling with challenges like higher fuel costs, increased operating expenses, and competitive pressure. But despite the challenges United Rentals has thrived, defying all odds. Unites Rentals is set to benefit from an extensive and diverse rental fleet, which allows it to serve a large range of customers across the world.
United Rentals recently published its first-quarter report for the year 2022:
- Total revenue of $ 2.53 billion, a 22.2 % year on year increase
- Net Income of $ 367 million
- The total fleet comprises 805,000 units.
The share of the company is currently trading at $ 293.69. the stock has been on a bullish run since 2020. In the year 2020, the stock appreciated by 40 % and closed off the year at a price of $ 231.91. In 2021, the stock continued its upward streak. The stock closed off at $ 332.29 after appreciating by 27.7 % during the year. In the current year, the stock changed course and started declining. To date, it has declined by approx. 11 %.
 Learn about head and shoulders patterns trading guide.
Howmet Aerospace
Howmet Aerospace Inc. is a leading global provider of advanced engineered solutions for the aerospace and transportation industries. The Company’s primary businesses focus on jet engine components, aerospace fastening systems, and airframe structural components necessary for mission-critical performance and efficiency in aerospace and defense applications, as well as forged wheels for commercial transportation. Get to know the best tech stocks to invest in now.
The company owns 1,150 granted and pending patents. What makes Howmet Aerospace unique in the industry is its differentiated technologies which enable lighter, more fuel-efficient aircraft and commercial trucks to operate with a lower carbon footprint.
The company recently published its first-quarter earnings report for the year 2022:
- Revenue of $ 1.324 billion, an increase of 9.5 % year-on-year.
- Commercial Aerospace contributed 44 % of the total revenue
- Defense Aerospace contributed 17 % of the total revenue
- Commercial transportation contributed 23 % of total revenue
- Industrial and other contributed 16 % of total revenue
- Earnings per share were reported at $ 0.31, an increase of 41% from the first quarter of 2021s
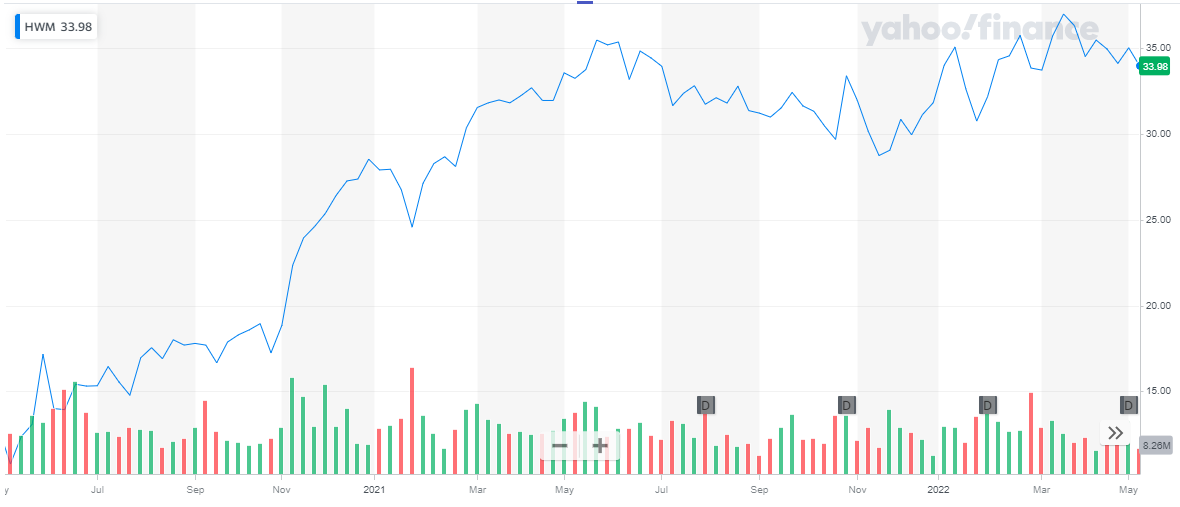
The stock of the company has been trading at a price of $ 33.98. the share has been on an upward streak since the year 2020. After the pandemic-led market crash, the company stock is now fully recovered and is trading on the pre-pandemic levels. During the year 2021, the stock appreciated by 14 % and closed off at a price of $ 31.83. In the current year, the stock has appreciated by approx. 10 % to date.
Check our updated for NASDAQ Forecast.
Textron
Textron Inc. is one of the world’s best-known multi-industry companies, recognized for its powerful brands such as Bell, Cessna, Beechcraft, E-Z-GO, Arctic Cat, and many more. The company leverages its global network of aircraft, defense, industrial, and finance businesses to provide customers with innovative products and services. Textron has a worldwide presence supported by 33,000 people in more than 25 countries. The cybersecurity stocks have become a high-growth sector and is attracting a lot of investor attention.
In the recent quarterly report, the company reported:
- Revenues of $ 3 billion, an increase of 3% from the same period last year
- Textron Aviation was the highest contributing segment
- Earnings per share of $ 0.88, as compared to $ 0.75 during the same period last year
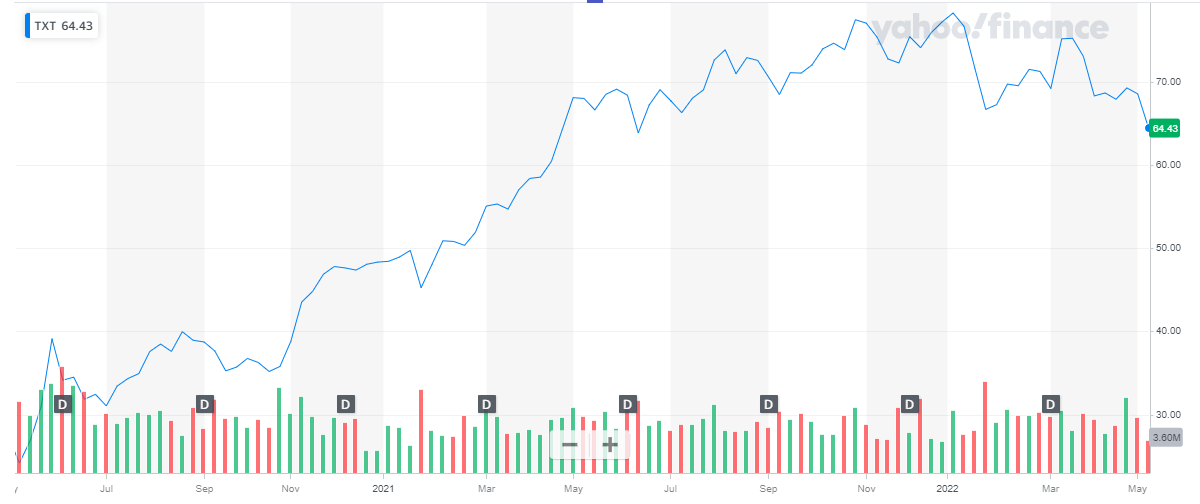
The stock of Textron is currently trading at $ 64.23. The share has been on a bullish run since the year 2020. After the initial plunge due to COVID-19 in the year 2020, the stock was able to recover by the end of the year. However, the upward journey of the stock continued in the year 2021 and it appreciated by approx. 60 % during the year. During the current year, the stock of Textron is exhibiting volatility and has declined by approx. 17 % to date.
 Also read: Best EV Stocks
Generac Holdings
Generac manufactures the widest range of power products in the marketplace including portable, residential, commercial, and industrial generators. The company was the first to engineer affordable home standby generators, along with the first engine developed specifically for the rigors of generator use, and is now the #1 manufacturer of home backup generators. Also read: Best Stocks for Covered Calls in 2022.
Generac also pioneered the residential power washer category and now has a complete line of an innovative, industry-leading power washers. The company washers are compatible with virtually any application, including the toughest commercial and industrial environments.
The company recently published its quarterly reports for the year 2021.
- Sales Revenue of $ 1.14 billion, an increase of 41 % as compared to the same period last year
- Residential product sales were $ 777 million, an increase of 43 %
- Commercial & Industrial (“C&I”) product sales were $ 279 million, an increase of 38 %
- Net Income was reported to be $ 114 million, a 23 % decline
- Earnings per share were reported to be $ 1.57
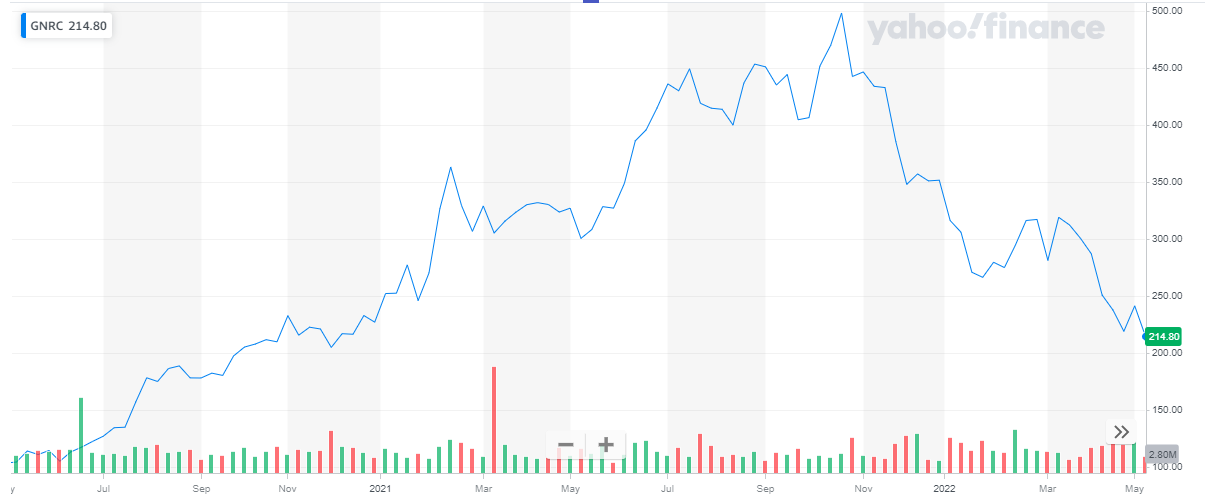
The share of Generac Holdings is currently trading at $ 223.33. The share picked up a bullish streak in the year 2020 and it continued till late 2021. The stock hit the peak of $ 498.56 in Oct ’21. After reaching the peak the stock instantly plunged. And at the end of the fiscal year, it closed at $ 351.92. in less than three months the stock dropped by almost 30%.
In the current year, the share of Generac Holding is experiencing volatility. After an initial rise, the stock has been declining again. The share has declined by 20%, in the current year, to date.
 Also check out Best Forex Brokers for Trading
Builders First Source
Builders First Source is the nation’s largest supplier of structural building products, value-added components, and services to the professional market for new residential construction and repair and remodeling. It has approximately 565 distribution and manufacturing locations, a presence in 42 states, and 85 of the top 100 Metropolitan Statistical Areas. Also check out: List of Most Volatile Stocks
In the recent quarterly report, the company reported:
- Revenues of $ 5.7 billion, as compared to $ 4.2 billion in the previous year’s first quarter
- Net income of $ 640 million, as compared to $ 173 billion during the same period last year
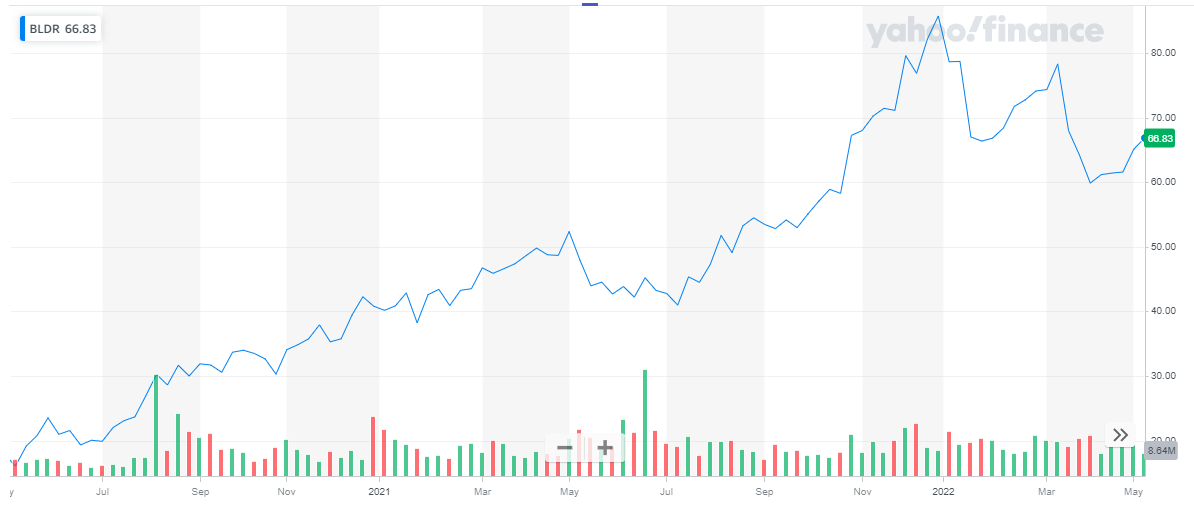
The stock of the company is currently trading at a price of $ 65.13. the company’s share has been on a bullish streak since 2020. In the year 2020, the stock appreciated by 62 % and closed off at $ 40.81. In the year 2021, the stock appreciated by 114%, closing off the year at a price of $ 85.71. During the current year, the stock has changed course and is experiencing volatility. In the year 2022, the stock has declined by approx. 22 % to date.
 There are many trading blogs designed for individual investors that are interested in choosing individual buzzing stocks.
CONCLUSION
Every sector has its own set of positives and negatives for investing. One of the major advantages of investing in the industrial sector is that its performance is correlated with the economy. On the contrary, this also acts as a downside. Because when the economy is falling, seeking an alternate source of income might become a challenge for investors.
The above-mentioned stocks have been selected based on their company size and growth of EPS over the years. Hence, they are one of the best industrial stocks for investment in the year 2022.