Risk Management

 Forex trading, also known as currency trading, involves buying and selling different currencies in an attempt to make a profit from fluctuations in exchange rates. While forex trading can be highly lucrative, it is also associated with significant risks. In this article, we will explore some of the main risks involved in forex trading and how traders can manage them.


One of the primary risks in forex trading is market risk. Market risk refers to the potential for losses due to changes in the value of currencies. The forex market is highly volatile, and exchange rates can fluctuate rapidly in response to economic, political, and social events. Traders must be prepared to handle market risk by understanding the factors that affect exchange rates and monitoring the markets closely.


Another risk in forex trading is counterparty risk. Counterparty risk refers to the potential for losses due to the failure of a broker or financial institution. Forex trading involves trading on margin, which means that traders borrow money from their broker to make trades. If the broker goes bankrupt or becomes insolvent, traders may lose their invested capital. To manage counterparty risk, traders should choose reputable brokers and monitor their financial stability.


Leverage is another risk associated with forex trading. Leverage refers to the use of borrowed funds to make trades. While leverage can amplify profits, it can also amplify losses. Traders must be aware of the risks of leverage and use it judiciously. It is important to maintain adequate margin levels to avoid margin calls, which can result in the closure of positions and significant losses.


Finally, forex trading also carries operational risks. Operational risks refer to the potential for losses due to technical issues, human error, or fraud. Traders should use reliable trading platforms, implement sound risk management strategies, and monitor their accounts closely to manage operational risks.


In conclusion, forex trading involves significant risks, including market risk, counterparty risk, leverage risk, and operational risk. Traders must be aware of these risks and take steps to manage them. By understanding the factors that affect exchange rates, choosing reputable brokers, using leverage judiciously, and implementing sound risk management strategies, traders can reduce their exposure to risk and increase their chances of success in forex trading.

Industrial Stocks to Buy in 2022


 In the United States and around the world, industrial stocks are one of the most long-lived industries. The economy's backbone is the industrial sector. For ages, this industry has been developing and increasing. There is still room for development and expansion. Websites that provide stock trading advice assist investors in making sound financial choices.

Investing in Industrial stocks has its own set of advantages:

  • The growth of industrial stocks is linked to economic growth and is highly cyclical. Therefore, when the economy is booming, industrial stocks prove to be the best investment. But economic growth slows or the economy goes downs, its time to put a stop to your investment in the industrial stock
  • Most industrial stocks have decades of history in the business; some are even centuries old. Hence investing in these industrial stocks gives investors ample data to analyze the stocks for investment worthiness
  • The majority of the industrial stocks are dividend-paying companies. Hence an excellent investment source for investors seeking a regular stream of income. 

On the contrary, no sector is far from its set of shortcomings. Therefore, investing in industrial stocks comes along with its own set of disadvantages:

  • Even though the majority of the industrial stocks are dividend-paying companies, their dividend yield is very low. Therefore, investors seeking a good return in terms of dividends have to seek other investments
  • Since industrial stocks are highly correlated with the economy, the political situation also greatly affects the industrial sector. In case of political unrest, the industrial sector goes down side by side.

List of Top 10 Industrial Stocks to Invest in 2022

Investing in any stock needs good research and should be according to the risk an investor is willing to take. Keeping in mind the investor preference, we have selected the Top 10 industrial stocks to invest in 2022:

Sr.Company NameSymbolMarket CapShare Price (As of 10 May 2022)
1CaterpillarCAT$ 108.3 billion$ 202.99
23MMMM$ 84.9 billion$ 149.12
3General ElectricGE$ 80.7 billion$ 73.31
4Waste ManagementWM$ 65.2 Billion$ 163.95
5FedExFDX$ 53.9 billion$ 208.06
6United Rentals Inc.URI$ 21 billion$ 293.69
7Howmet AerospaceHWM$ 14.2 billion $ 33.98
8TextronTXT$ 13.9 billion$ 64.23
9Generac HoldingsGNRC$ 13.65 billion$ 223.33
10Builders First SourceBLDR$ 11.62 billion$ 65.13


Caterpillar

Caterpillar Inc. is the world’s leading manufacturer of construction and mining equipment, off-highway diesel and natural gas engines, industrial gas turbines, and diesel-electric locomotives. Caterpillar has a presence all over the world, on every continent. The company operates through three primary segments:

  • Construction Industries
  • Resource Industries 
  • Energy & Transportation

The company also provides financing and related services through its Financial Products segment.

The company has recently published its first-quarter report for the year 2022:

  • Revenue of $ 13.6 billion, an increase of 14 % from the same period last year
  • Operating Profit of $ 1.9 billion, an increase of 5.6 % from the same period last year

The company’s share is currently trading at a price of $ 202.99. The share peaked at $ 244 in May 2021. During the year 2021, the share appreciated by approx. 2%. In the current year, the stock of Caterpillar has been volatile. After hitting $228, the company’s stock declines. During the current year, the stock has declined by approx. 2% to date.

Semi conductor stocks are one of the best investment opportunities.

3M

3M Company operates as a diversified technology company worldwide. It operates through four segments: 

  • Safety and Industrial
  • Transportation and Electronics
  • Health Care
  • Consumer

In the recent quarterly earnings report, the company reported:

  • Revenue of $ 8.8 billion, a decrease of 0.3% year-on-year
  • Earnings per share were $ 2.26, an 18% decline year-on-year

The stock of 3M is currently trading at $ 149.12. The stock peaked at $ 206 in May 2021. The year 2020 is marked by a bullish run. This bullish streak lasted till May 2021 when the stock hit its peak price. After that, the stock of 3M has been steadily declining. 

During the current year, the stock has experienced a huge drop in price. Starting off at a price of $ 179.95, the stock closed off at $ 149.12 on the last trading day. This represents a decline of 17 % to date.

Oil stocks is one of the riskier yet most profit-generating sectors.

General Electric

General Electric Company is a high-tech industrial. It operates through four segments: 

  • Power
  • Renewable Energy
  • Aviation
  • Healthcare segments

General Electric Company is popular for its LEAP aircraft engines, Heavy-Duty gas turbines, Haliade-X and Cypress wind turbines, and healthcare solutions. The company’s continuous effort and investment towards the upgradation and innovation of products paves way for growth. Moreover, the company offers great technological expertise in the field of business which adds to growth. Going forward, GE plans to focus on Power, Aviation, and Renewable Energy and strengthen its industrial business. This is expected to improve the balance sheet and increase shareholders’ value. Oil and gas ETFs are a great addition to the investment portfolio. We also have covered best ETFs to buy in all categories.

In the first-quarter earnings report for the year 2022, the company reported:

  • Revenues of $ 16.3 billion
  • Net Profit of $ 0.9 billion, a 19% increase year-on-year

The share of General Electric is currently trading at $ 73.31. The share peaked at $ 112.48 in May 2021. Amazingly, the stock of GE maintained its price level for the next few months before dropping slightly by the end of the year 2021. The share closed off in the year 2021, at a price of $ 94.47. in the current year, the stock of GE is on a downward path and has declined by 27% to date.

If you are seeking a steady stream of income, you should invest in REIT stocks.

Waste Management

Waste Management is the leading provider of comprehensive environmental services in North America. Through its subsidiaries, WM provides collection, transfer, disposal services, recycling, and resource recovery. It is also a leading developer, operator, and owner of landfill gas-to-energy facilities in the United States. Thinking to invest in bonds? Get to know whether its a good decision to invest in bonds or stocks.

The company recently announced that it expects to invest $ 200 million in recycling infrastructure in 2022. This new investment will take the company’s investment in new and upgraded recycling facilities to over $700 million, in 2018. The continuous investment in recycling will enable WM to capture more recycled materials and increase access to recycling for its customers.

In the first quarter report for the year 2022 the company reported:

  • Revenues of $4.7 billion, an increase of 13 % from the same period last year.
  • Net income of $ 513 million, an increase of 22 % from the same period last year. 

The stocks of WM are currently trading at a price of $ 156.95. The company’s share has been on a bullish streak since 2021. In the year 2021, the share appreciated by 40%. In the current year, the stock has maintained its price level, year-to-date.

Get to know best vaccine stocks to invest in now.

FedEx

FedEx Corporation provides transportation, e-commerce, and business services in the United States and internationally. The companies’ operations have been divided into multiple segments; each segment has its individual role:

  • The FedEx Express segment offers express transportation, small-package ground delivery, and freight transportation services; time-critical transportation services; and cross-border e-commerce technology and e-commerce transportation solutions. 
  • The FedEx Ground segment provides day-certain delivery services to businesses and residences. 
  • The FedEx Freight segment offers less-than-truckload freight transportation services. 

The year 2020 changed the fate of FedEx. It was one of the few industrial stocks that thrived during this time. The company has benefitted hugely from economic growth and a prolonged surge in e-commerce.

In the recent quarterly earnings report, FedEx reported:

  • Total revenue of $ 23.6 billion, an increase of 10 % year-on-year
  • 1operatingincome was reported to be $ 1.33 billion, an increase of 32 % year-on-year
  • Net Income was reported at $ 1.2 billion, an increase of 30 % year-on-year

The company’s stock is currently trading at a price of $ 208.06. The stock peaked at $ 314.69 in May 2021. The pandemic gave a huge boost to the share price. After hitting the peak price, the stock has declined.

Get to know the list of crypto mining companies that are leading the industry.

United Rentals

United Rentals is the largest equipment rental company in the world. It has a very vast store network and has a presence in 49 states and ten Canadian provinces. Also learn about Best Day Trading Stocks

No doubt the company has been grappling with challenges like higher fuel costs, increased operating expenses, and competitive pressure. But despite the challenges United Rentals has thrived, defying all odds. Unites Rentals is set to benefit from an extensive and diverse rental fleet, which allows it to serve a large range of customers across the world.

United Rentals recently published its first-quarter report for the year 2022:

  • Total revenue of $ 2.53 billion, a 22.2 % year on year increase
  • Net Income of $ 367 million
  • The total fleet comprises 805,000 units. 

The share of the company is currently trading at $ 293.69. the stock has been on a bullish run since 2020. In the year 2020, the stock appreciated by 40 % and closed off the year at a price of $ 231.91. In 2021, the stock continued its upward streak. The stock closed off at $ 332.29 after appreciating by 27.7 % during the year. In the current year, the stock changed course and started declining. To date, it has declined by approx. 11 %.

 Learn about head and shoulders patterns trading guide.

Howmet Aerospace

Howmet Aerospace Inc. is a leading global provider of advanced engineered solutions for the aerospace and transportation industries. The Company’s primary businesses focus on jet engine components, aerospace fastening systems, and airframe structural components necessary for mission-critical performance and efficiency in aerospace and defense applications, as well as forged wheels for commercial transportation. Get to know the best tech stocks to invest in now.

The company owns 1,150 granted and pending patents. What makes Howmet Aerospace unique in the industry is its differentiated technologies which enable lighter, more fuel-efficient aircraft and commercial trucks to operate with a lower carbon footprint.

The company recently published its first-quarter earnings report for the year 2022:

  • Revenue of $ 1.324 billion, an increase of 9.5 % year-on-year.
    • Commercial Aerospace contributed 44 % of the total revenue
    • Defense Aerospace contributed 17 % of the total revenue
    • Commercial transportation contributed 23 % of total revenue
    • Industrial and other contributed 16 % of total revenue
  • Earnings per share were reported at $ 0.31, an increase of 41% from the first quarter of 2021s

The stock of the company has been trading at a price of $ 33.98. the share has been on an upward streak since the year 2020. After the pandemic-led market crash, the company stock is now fully recovered and is trading on the pre-pandemic levels. During the year 2021, the stock appreciated by 14 % and closed off at a price of $ 31.83. In the current year, the stock has appreciated by approx. 10 % to date. 

Check our updated for NASDAQ Forecast.

Textron

Textron Inc. is one of the world’s best-known multi-industry companies, recognized for its powerful brands such as Bell, Cessna, Beechcraft, E-Z-GO, Arctic Cat, and many more. The company leverages its global network of aircraft, defense, industrial, and finance businesses to provide customers with innovative products and services. Textron has a worldwide presence supported by 33,000 people in more than 25 countries. The cybersecurity stocks have become a high-growth sector and is attracting a lot of investor attention.

In the recent quarterly report, the company reported:

  • Revenues of $ 3 billion, an increase of 3% from the same period last year
    • Textron Aviation was the highest contributing segment
  • Earnings per share of $ 0.88, as compared to $ 0.75 during the same period last year

The stock of Textron is currently trading at $ 64.23. The share has been on a bullish run since the year 2020. After the initial plunge due to COVID-19 in the year 2020, the stock was able to recover by the end of the year. However, the upward journey of the stock continued in the year 2021 and it appreciated by approx. 60 % during the year. During the current year, the stock of Textron is exhibiting volatility and has declined by approx. 17 % to date.

Also read: Best EV Stocks

Generac Holdings

Generac manufactures the widest range of power products in the marketplace including portable, residential, commercial, and industrial generators. The company was the first to engineer affordable home standby generators, along with the first engine developed specifically for the rigors of generator use, and is now the #1 manufacturer of home backup generators. Also read: Best Stocks for Covered Calls in 2022.

Generac also pioneered the residential power washer category and now has a complete line of an innovative, industry-leading power washers. The company washers are compatible with virtually any application, including the toughest commercial and industrial environments.

The company recently published its quarterly reports for the year 2021. 

  • Sales Revenue of $ 1.14 billion, an increase of 41 % as compared to the same period last year
    • Residential product sales were $ 777 million, an increase of 43 % 
    • Commercial & Industrial (“C&I”) product sales were $ 279 million, an increase of 38 % 
  • Net Income was reported to be $ 114 million, a 23 % decline
  • Earnings per share were reported to be $ 1.57

The share of Generac Holdings is currently trading at $ 223.33. The share picked up a bullish streak in the year 2020 and it continued till late 2021. The stock hit the peak of $ 498.56 in Oct ’21. After reaching the peak the stock instantly plunged. And at the end of the fiscal year, it closed at $ 351.92. in less than three months the stock dropped by almost 30%.

In the current year, the share of Generac Holding is experiencing volatility. After an initial rise, the stock has been declining again. The share has declined by 20%, in the current year, to date.

Also check out Best Forex Brokers for Trading 

Builders First Source

Builders First Source is the nation’s largest supplier of structural building products, value-added components, and services to the professional market for new residential construction and repair and remodeling. It has approximately 565 distribution and manufacturing locations, a presence in 42 states, and 85 of the top 100 Metropolitan Statistical Areas. Also check out: List of Most Volatile Stocks

 In the recent quarterly report, the company reported:

  • Revenues of $ 5.7 billion, as compared to $ 4.2 billion in the previous year’s first quarter
  • Net income of $ 640 million, as compared to $ 173 billion during the same period last year

The stock of the company is currently trading at a price of $ 65.13. the company’s share has been on a bullish streak since 2020. In the year 2020, the stock appreciated by 62 % and closed off at $ 40.81. In the year 2021, the stock appreciated by 114%, closing off the year at a price of $ 85.71. During the current year, the stock has changed course and is experiencing volatility. In the year 2022, the stock has declined by approx. 22 % to date.

There are many trading blogs designed for individual investors that are interested in choosing individual buzzing stocks.

CONCLUSION

Every sector has its own set of positives and negatives for investing. One of the major advantages of investing in the industrial sector is that its performance is correlated with the economy. On the contrary, this also acts as a downside. Because when the economy is falling, seeking an alternate source of income might become a challenge for investors.

The above-mentioned stocks have been selected based on their company size and growth of EPS over the years. Hence, they are one of the best industrial stocks for investment in the year 2022.

At The Blue Box Area, The NZDUSD Is Selling Rallies.

NZDUSD


  We'll take a quick look at the Elliott Wave charts of the NZDUSD currency pair in this technical blog. The pair has been showing bearish sequences in the cycle since the February 2021 peak, as our members are aware. The pair recently bounced three times, reaching our selling zone and providing us with solid trading possibilities. The Elliott Wave Forecast and trading approach will be discussed further in this article.

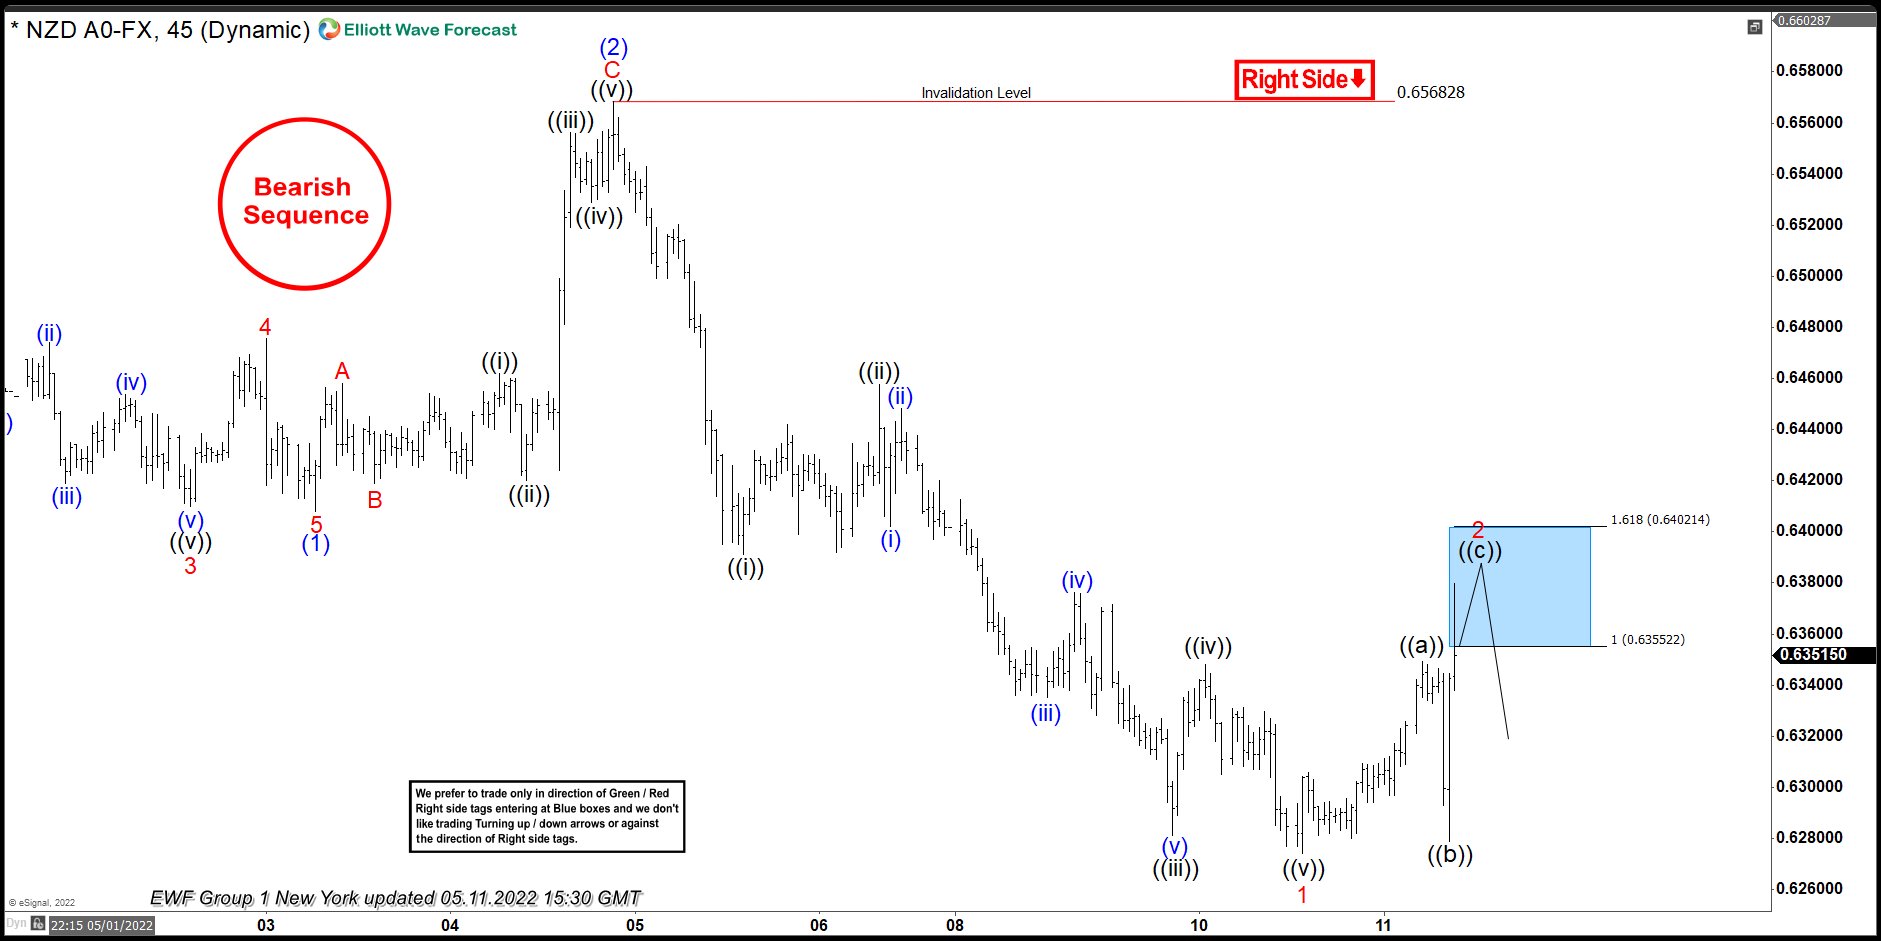
H1 Elliott Wave Analysis of the NZDUSD 05.11.2022

From the 0.65682 peak, the NZDUSD is correcting the cycle. To complete 2 red recovery, recovery has already reached the blue box at 0.63552-0.64021. We advised members to avoid purchasing the pair, as we like the blue box's short side. Selling the pair at the highlighted zone is the strategy. Breaking above 1.618 fibs extension: 0.64021 would invalidate the trade. We predict sellers to arrive in the blue box for at least three waves of pullback because the main trend is bearish. We will enter a risk-free short position (put SL at BE) and take partial profits whenever the pullback approaches 50 Fibs versus the ((b)) black low.

As our members know Blue Boxes are no enemy areas , giving us 85% chance to get a reaction.

Reminder: You can learn about Elliott Wave Rules and Patterns at our Free Elliott Wave Educational Web Page.

NZDUSD

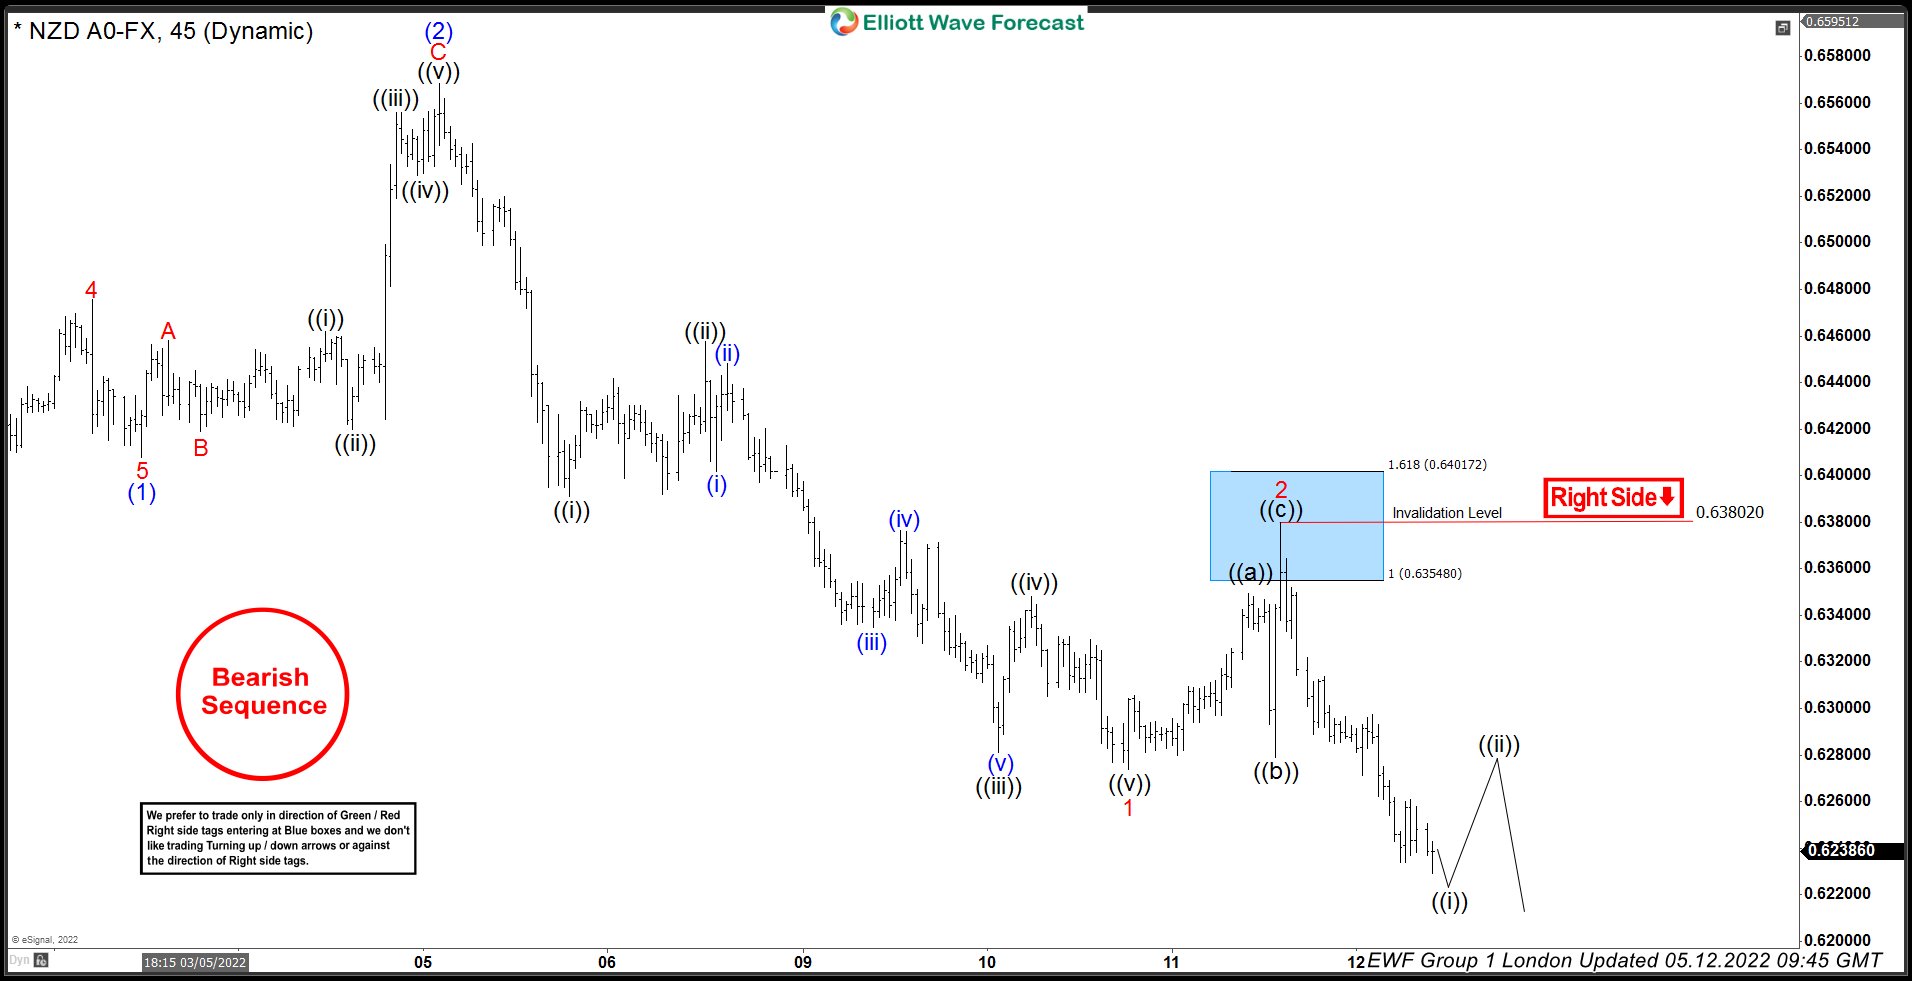
NZDUSD H1 Elliott Wave Analysis 05.12.2022

The pair found sellers at the blue box area: 0.63552-0.64021 and made turn lower from there.   As a result , members who took short trades made positions risk free ( Put SL at BE) and took partial profits. We got a break toward new lows which makes the pair bearish against the 0.63802 peak in first degree.   At this stage we see wave 2 red completed at the 0.6380 high. While mentioned pivot holds, the pair can keep finding intraday sellers in 3,7,11 swings for a further extension down.

Keep in mind market is dynamic and presented view could have changed in the mean time. You can check most recent charts in the membership area of the site. Best instruments to trade are those having incomplete bullish or bearish swings sequences.We put them in Sequence Report and best among them are shown in the Live Trading Room.

Fibonacci Confluence on FX Pairs

 Talking Points:

- As looked at earlier in this module, Fibonacci retracements can help traders to identify possible support/resistance.

- We’ve previously discussed how a trader can use Fibonacci retracements on long-term-charts, and by focusing on multiple major moves traders may be able to glean confluent areas of support/resistance. This can provide multiple reasons for buyers or sellers to defend these key spots on the chart, keeping the door open for reversals or retracements.

Fibonacci is wrapped in mystique, and this makes the story around it that much more interesting. But for applicability in markets, the simple version is that Fibonacci retracement levels offer potential areas for support and/or resistance to develop; and because market participants may use these levels in their analysis and, in turn, because these prices have potential impact for price behavior, this can be an excellent addition to the FX traders repertoire of support and resistance analysis.

Origins

Italian mathematician Leonardo Fibonacci is credited with finding the Fibonacci sequence in the 13th century, hence the name ‘Fibonacci’. And while his book Liber Abaci introduced the Fibonacci sequence to the western world, traces can actually be found going back as far as 200 BC in Indian mathematics. The sequence is fairly simple: Two numbers added together produce the next value. So 1+1 = 2, and then 1+2 = 3, and then 2+3 = 5, 5+3 = 8, and so on. The first 22 values of the Fibonacci sequence are printed below:

1, 1, 2, 3, 5, 8, 13, 21, 34, 55, 89, 144, 233, 377, 610, 987, 1597, 2584, 4181, 6765, 10946, 17711

This starts to get interesting once we look at the numbers relationship within the sequence to each other. If we take a value and divide by the preceding value, we will get a number approximately close to 161.8%. So, each number in the sequence is 161.8% greater than the prior value after we get out of the initial portion of the sequence (after the value of 89). This is the Golden Ratio of 161.8%.

17711/10946 = 1.61803

10946/6765 = 1.61803

6765/4181 = 1.61803

What struck Fibonacci almost a thousand years ago and the same thing that amazed a thousand years before that is how widely this ratio, and this sequence can be found in the world around us. In Liber Abaci, Fibonacci used the mating cycle of rabbits as an example, showing how rabbit populations in isolation would grow according to the numerical sequence of 1, 1, 2, 3, 5, 8, 13, etc. But this is just the tip of the iceberg, the number of flower petals will often follow the sequence: Lilies have three petals while buttercups have five, chicory’s have 21 and daisies have 34. Each petal is placed at .618 per turn in order to allow for maximum sunlight. Tree branches, in the way that trunks split and in the way that branches will grow, display the Fibonacci sequence. Shells, hurricanes – even human faces adhere to the Golden ratio in a geometric spiral pattern.

Right now, you can look down at your right arm to notice that you probably have eight fingers, five on each hand, three bones in each finger,two bones in each one thumb and one thumb on each hand. Oh – and the ratio between your forearm and hand – that probably applies by the Golden ratio, as well.

Applicability to Markets

While the application of Fibonacci in nature keeps many graduate level mathematics students busy, traders have more pressing concerns: Applying the study to financial markets. In its most common form, Fibonacci is the use of the golden ratio in support and resistance analysis. So, plot a significant move, draw a line at 61.8% of that move, and we have an area to watch for a possible retracement to find support. The reciprocal of .618 is .382, so this gives us another value to work with at the 38.2% level.

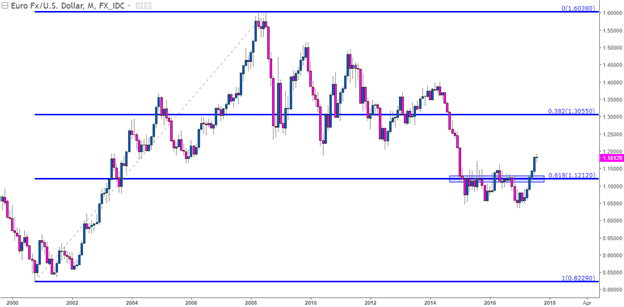
On the chart below, we’re looking at the lifetime move in EUR/USD, taking the low in the year 2000 up to the high in 2009. We start at the beginning of the move and draw the retracement to the top, and 38.2% of the way-down we can see the retracement at 1.3056. We can also see the 61.8% retracement of this move at 1.1212. Notice how this level helped to set resistance in the pair for 15 out of 30 months after the level came into play in January of 2015. As EUR/USD was dropping like a rock in anticipation of ECB QE coming online in a few short months, we caught support at this level on the way down in January of 2015; but after that we had eight consecutive months of resistance showing at or around this key 61.8% retracement level.

EUR/USD Monthly: 15 of 30 Months with Resistance at 61.8% Retracement, 3 Months of Support


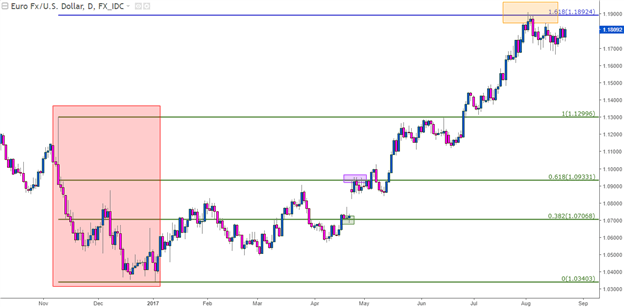
The past few months have been quite the wild ride for EUR/USD. After a rather threatening drop around the U.S. Presidential Election leading into the start of 2017 (shown in red below), the pair put in an aggressive reversal as bulls have run amok. But – when prices were in the process reversing from the prior bearish mode into a more bullish state, the 38.2% retracement of the post-Election move showed up as a bit of support (shown in green) before the 61.8% retracement provided a bit of resistance (indicated with purple). After prices broke above those highs and ran with reckless abandon, resistance has begun to show at the 161.8% extension of that move (orange box)

EUR/USD Daily: Fib Applied to recent move in EUR/USD, 161.8 Extension Providing Resistance


Taking it a Step Further

Levels found at 61.8 and 38.2% retracements can be valuable for traders, and this can be seen on major moves of all stripes and flavors. This can be applied on short-term charts just like long-term charts, but as is usually the case in technical analysis, longer-term studies will have a tendency to be a bit more consistent given the larger number of opinions over the greater evaluation period.

But we can go a step further with Fibonacci analysis. Earlier, we shared that .382 is the reciprocal of .618, and this is true – but this isn’t the only relevance behind .382. If we take any number in the sequence after the initial set of values, and divide it by the value two places further in the sequence – we will have .382 or 38.2%.

13/34 = .382

21/55 = .3818 – rounded up to .382

34/89 = .382

55/144 = .3819

But we can go even a step further by dividing a value in the sequence by the value three places later to consistently arrive at a value of 23.6.

13/55 = .2363

21/89 = .2359

34/144 = .2361

55/233 = .2361

This gives us another retracement value to work with of 23.6%. So, now we have the 23.6, 38.2 and 61.8% retracement levels to apply in the effort of finding support and/or resistance.

We’re not done yet: We can still take this a step further. With 23.6, 38.2 and 61.8% retracement levels, the study will be rather uneven with two values in one half of the retracement and only one in the latter half. This has elicited creativity across market participants, as many will simply take the reciprocal of 23.6 and apply that as a level, as well. This would be the 76.4% retracement, which doesn’t have any actual Fibonacci relevance behind it. But – at .786 we have an interesting number to work with, as this is the square root of .618, and can be a potentially more attractive stand-in to .764.

This now gives us four values across the chart, and out of practice, many traders will apply a mid-line at 50% which, again, has no actual Fibonacci value; but that observation is far less important to traders than the fact that other traders and analysts have it on their chart and, hence, may respond to it.

This now gives us five values to work with when applying Fibonacci retracements to trading analysis: 23.6, 38.2, 50, 61.8 and 78.6 (or 76.4).

Putting it All Together

As previously noted, the purpose of this analysis is not to show us what will definitely happen in the future. No form of analysis can bring that, whether it’s based on Fibonacci, Astrology or Psychological levels. The value in support and resistance identification is in the ability to manage risks with trading setups. If prices are trending higher, fantastic, then look to buy support so that if the up-trend does break-down, you can get out at a minimum of a loss, all in the effort of mitigating the damage when markets inevitably turn-around. But if that up-trend does continue, bingo, you’re in a great spot to manage a winning position.

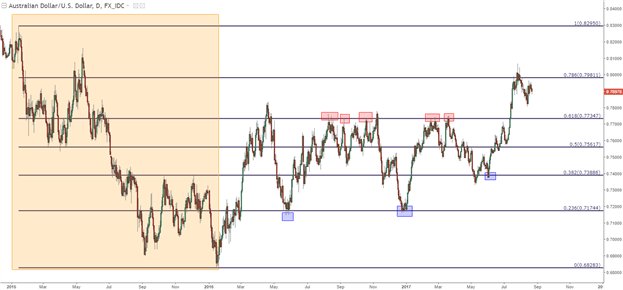
The key to applying Fibonacci retracements is to find a workable major move, and then to allow price action to be the guide in how each level should be approached. On the daily chart of AUD/USD below, we’re looking at a Fibonacci retracement applied to a previous bearish move. The 2015 high drawn down to the 2016 low is shown in orange below, and we’ve used red and blue boxes to highlight a few of the more prominent instances of resistance or support to have developed off of these intervals.


Notice that while the above chart is far from perfect in the fact that it did not catch every point of support or resistance, it did show quite a few. As we discussed in our last article, the prospect of confluence can incorporate levels from different styles of analysis, such as psychological whole numbers.

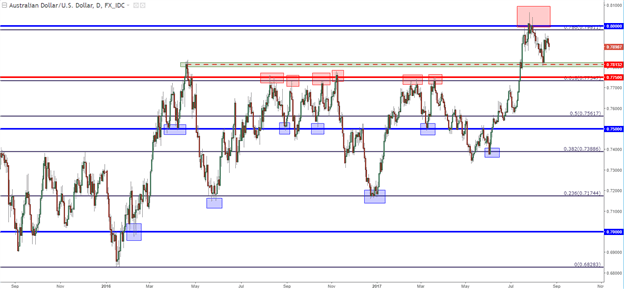
On the below chart of AUD/USD, we took the same Fibonacci retracement above and added in levels for the psychological levels at .7000, .7500 and .8000, along with a price action swing indicated with a green box. Notice, that while we don’t catch every top or bottom, we catch quite a few of them with these very simple forms of analysis. And that resistance that held in the pair around the 61.8% retracement, that level is confluent with the .7750 psychological level, and this is likely why that level was so difficult for bulls to break through.

AUD/USD Daily: Confluence of Support and Resistance


With this system of support and resistance in the analytical quiver of traders, price action can be utilized to figure out how to trade with each of these potential support or resistance inflections based on the context of that market’s condition at a specific point in time.